Data Without Borders is a data science course geared computer science and statistical analysis with a focus on the R programming language. It’s being taught by Jake Porway. Here’s a detailed description of the course:
Students will learn to scrape, merge, and clean data with Python, perform statistical analysis and use machine learning algorithms with the R programming language, and visualize and explore data with D3. In addition to training you as data scientists, we will discuss the important social issues around data provenance, privacy, and the responsibility that comes with making claims from data.
Our first assignment used the available NYC stop-and-frisk dataset, which marks stops, frisks, arrests, the associated crime, as well as gender, race, and age data. The .csv is available here. We had to answer the following questions using R:
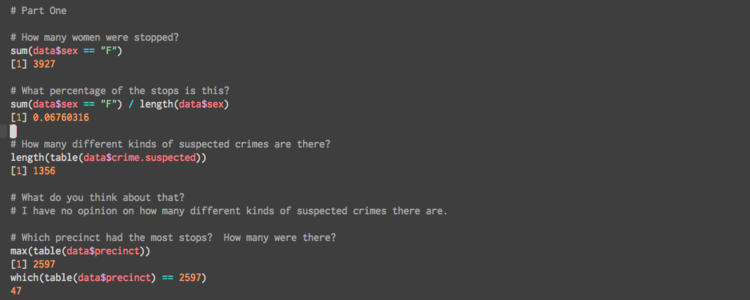
- How many women were stopped? What percentage of the stops is this?
- How many different kinds of suspected crimes are there? What do you think about that? Is that what you expected?
- Which precinct had the most stops? How many were there? Which precinct had the least stops?
- How many people between 18 and 30 were stopped?
Being a resident of NYC, and subjected to random searches on entrance to the subway, I have a somewhat intimate connection to this dataset. It’s very easy to look at a dataset about people as pure numbers. However, that would be a mistake.
I posted my answers here.
Additionally, we had to select our own small data set and create a plot of the data. I chose a data set of NYC bike rack locations. Here’s the plot:
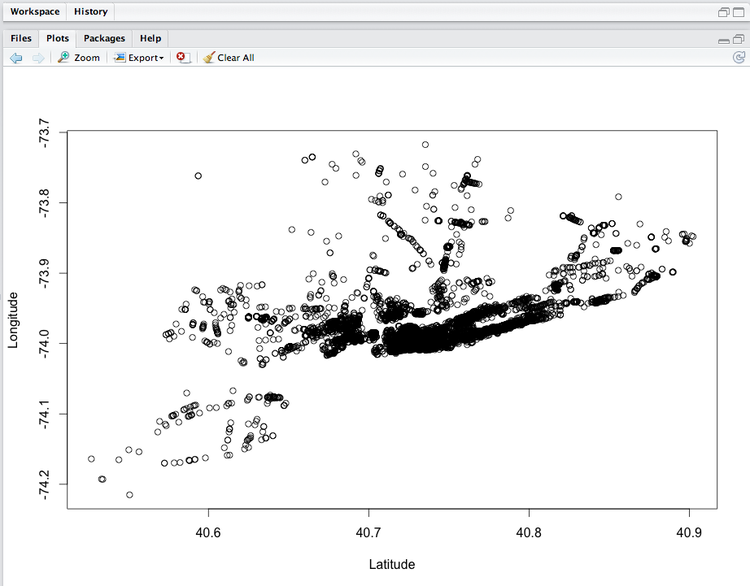
As you can see, the area between 40.7 and 40.8 latitude and -74 longitude has the heaviest concentration of bike racks, which spans Manhattan.